


| Rank This Year | Rank Last Year | Company | Revenue (000) | Net Income (000) | Employees | Tractors* | Trailers |
|---|---|---|---|---|---|---|---|
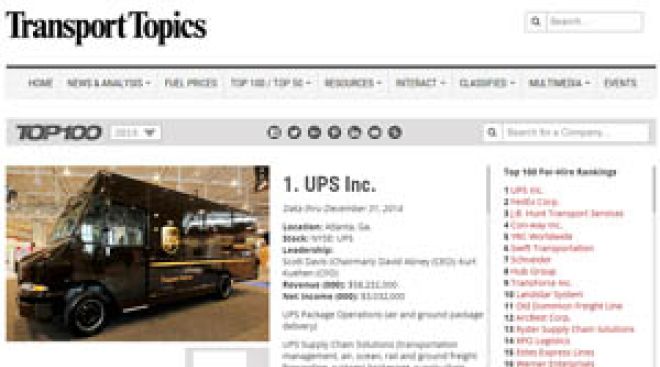
| 1 | 1 | UPS Inc.
|
58,232,000 | 3,032,000 | 435,000 | 106,000 | |
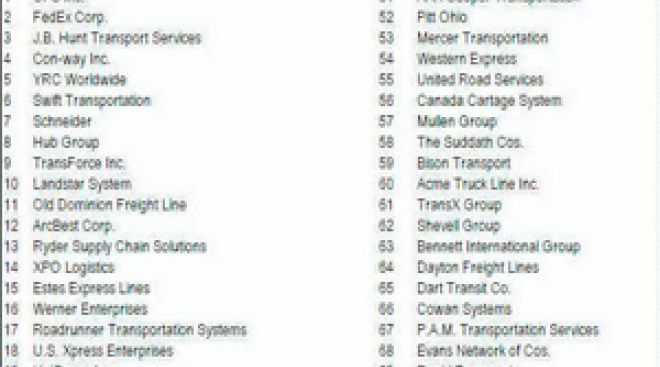
| 2 | 2 | FedEx Corp.
|
47,100,000 | 2,532,000 | 325,000 | 26,594 | 97,469 |
| 3 | 3 | J.B. Hunt Transport Services
|
6,165,441 | 374,792 | 20,158 | 12,995 | 27,731 |
| 4 | 4 | Con-way Inc.
|
5,806,069 | 137,039 | 30,100 | 12,100 | 33,300 |
| 5 | 5 | Yellow Corp.
|
5,068,800 | -67,700 | 33,000 | 6,400 | 13,000 |
| 6 | 6 | Swift Transportation
|
4,298,724 | 161,151 | 21,274 | 18,836 | 61,652 |
| 7 | 7 | Schneider
|
3,900,000 | - | 17,450 | 12,300 | 32,350 |
| 8 | 8 | Hub Group
|
3,571,126 | 51,558 | 2,568 | 2,977 | 448 |
| 9 | 9 | TFI International
|
3,363,213 | 138,902 | 16,050 | 14,980 | 18,680 |
| 10 | 10 | Landstar System
|
3,184,790 | 138,809 | 1,211 | 8,662 | 13,732 |
| 11 | 12 | Old Dominion Freight Line
|
2,787,897 | 267,514 | 18,804 | 6,907 | 27,635 |
| 13 | 11 | Ryder System
|
2,461,149 | 122,356 | 4,098 | 6,042 | |
| 14 | 43 | XPO
|
2,356,600 | -63,600 | 10,000 | 6,200 | |
| 15 | 16 | Estes Express Lines
|
2,173,000 | - | 15,815 | 6,620 | 24,592 |
| 16 | 14 | Werner Enterprises
|
2,139,289 | 98,650 | 10,664 | 7,105 | 22,305 |
| 17 | 21 | Roadrunner Freight
|
1,872,816 | 51,974 | 4,142 | 4,170 | 5,135 |
| 18 | 18 | U.S. Xpress Enterprises
|
1,730,000 | - | 7,770 | 17,000 | |
| 19 | 17 | UniGroup
|
1,700,000 | - | 1,150 | 5,001 | 8,500 |
| 20 | 23 | Kenan Advantage Group
|
1,567,453 | - | 7,265 | 6,455 | 9,448 |
| 21 | 22 | Prime Inc.
|
1,563,413 | 207,436 | 4,450 | 6,187 | 10,637 |
| 22 | 19 | Purolator
|
1,524,071 | - | 11,500 | 489 | 1,286 |
| 23 | 20 | C.R. England
|
1,517,290 | - | 7,385 | 4,087 | 5,923 |
| 24 | 15 | Sirva
|
1,464,400 | - | 2,700 | 2,609 | 4,263 |
| 25 | 24 | CRST The Transportation Solution
|
1,351,571 | - | 5,129 | 4,394 | 7,290 |
| 26 | 25 | Saia Inc.
|
1,272,321 | 51,991 | 8,900 | 3,780 | 11,530 |
| 27 | 28 | Universal Logistics Holdings
|
1,191,521 | 45,370 | 4,218 | 4,408 | 6,291 |
| 28 | 27 | Southeastern Freight Lines
|
1,171,968 | - | 8,299 | 3,599 | 11,496 |
| 29 | 32 | Penske Logistics
|
1,137,000 | - | 13,000 | 2,054 | 4,918 |
| 30 | 26 | NFI
|
1,105,000 | - | 8,000 | 2,264 | 7,500 |
| 31 | 31 | Knight-Swift Transportation Holdings
|
1,102,332 | 102,862 | 5,526 | 4,738 | 11,487 |
| 32 | 30 | Crete Carrier Corp.
|
1,100,000 | - | 5,500 | 5,130 | 12,883 |
| 33 | 29 | Averitt Express
|
1,078,000 | - | 4,441 | 13,075 | |
| 34 | 47 | Forward Air
|
1,010,959 | 61,169 | 3,600 | 1,300 | 3,100 |
| 36 | 34 | Quality Carriers
|
991,758 | 20,640 | 1,188 | 3,195 | 3,171 |
| 37 | 36 | Atlas World Group
|
878,313 | 9,542 | 644 | 2,086 | 4,012 |
| 38 | 41 | Anderson Trucking Service
|
873,432 | - | 1,389 | 2,519 | 6,127 |
| 39 | 33 | Heartland Express
|
871,355 | 84,834 | 4,500 | 4,776 | 12,970 |
| 40 | 42 | KLLM Transport Services
|
863,000 | - | 3,800 | 5,500 | |
| 41 | 38 | Ruan
|
848,759 | - | 5,595 | 3,754 | 8,395 |
| 42 | 45 | Celadon Group Inc.
|
806,400 | 35,579 | 4,582 | 4,031 | 11,180 |
| 43 | 37 | Jack Cooper Holdings
|
790,000 | - | 3,500 | ||
| 44 | 39 | Day & Ross
|
771,988 | - | 1,602 | 1,552 | 3,103 |
| 45 | 40 | Trimac Transportation
|
737,725 | - | 3,262 | 2,167 | 4,679 |
| 46 | 44 | Covenant Logistics Group
|
718,980 | 17,808 | 4,400 | 2,665 | 6,722 |
| 47 | 47 | Stevens Transport
|
673,160 | 91,310 | 2,835 | 2,775 | 3,782 |
| 49 | 60 | Daseke Inc. (TFI)
|
668,000 | - | 2,500 | 2,610 | 5,515 |
| 50 | 51 | USA Truck
|
602,477 | 6,285 | 2,183 | 6,216 | |
| 51 | 49 | AAA Cooper Transportation
|
580,371 | - | 4,500 | 2,450 | 6,000 |
| 52 | 60 | Pitt Ohio
|
551,300 | - | 3,140 | 812 | 2,037 |
| 53 | 57 | Mercer Transportation
|
547,269 | - | 325 | 2,189 | 2,189 |
| 54 | 57 | Western Express
|
540,104 | - | 3,107 | 2,404 | 5,700 |
| 55 | 74 | United Road Services
|
532,000 | - | 1,700 | 1,772 | |
| 56 | 51 | Canada Cartage
|
516,976 | - | 2,543 | 2,417 | |
| 57 | 52 | Mullen Group
|
516,878 | - | 2,092 | 1,374 | 3,529 |
| 58 | 54 | Suddath
|
500,000 | - | 2,000 | 384 | 754 |
| 59 | 55 | Bison Transport
|
398,990 | - | 2,321 | 1,502 | 3,857 |
| 60 | 70 | Acme Truck Line
|
487,208 | - | 3,000 | 2,007 | 2,257 |
| 61 | 54 | TransX Group of Companies
|
482,571 | - | 2,560 | 1,505 | 4,240 |
| 62 | 58 | Shevell Group
|
461,000 | - | 3,559 | 1,920 | 4,600 |
| 63 | 76 | Bennett Family of Cos.
|
436,024 | - | 772 | 1,408 | 1,418 |
| 64 | 65 | Dayton Freight Lines
|
436,000 | - | 3,610 | 1,228 | 3,109 |
| 65 | 61 | Dart Transit Co.
|
425,503 | 3,854 | 1,365 | 1,875 | 5,789 |
| 66 | 67 | Cowan Systems
|
421,515 | - | 1,700 | 1,748 | 3,795 |
| 67 | 63 | P.A.M. Transport
|
410,937 | 13,491 | 2,911 | 1,761 | 4,919 |
| 68 | 81 | Evans Delivery
|
400,000 | - | 275 | 3,150 | 525 |
| 69 | 66 | Roehl Transport
|
395,971 | - | 2,500 | 2,255 | 4,090 |
| 71 | 68 | Mesilla Valley Transportation
|
372,000 | - | 1,700 | 1,300 | 4,800 |
| 72 | 79 | California Cartage Co.
|
368,700 | - | 1,200 | ||
| 73 | 79 | Epes Carriers Inc.
|
341,494 | 24,001 | 1,359 | 1,121 | 5,500 |
| 74 | 83 | Cassens Transport
|
328,649 | - | 1,445 | 1,371 | |
| 75 | 82 | A. Duie Pyle
|
318,811 | - | 2,500 | 822 | 1,900 |
| 76 | 80 | Maverick USA
|
316,018 | 21,044 | 1,813 | 1,376 | 1,983 |
| 77 | 73 | Comcar Industries
|
315,972 | - | 2,409 | 1,937 | 4,226 |
| 78 | 77 | Challenger Motor Freight
|
300,130 | - | 1,900 | 1,640 | 3,300 |
| 79 | 84 | Koch Cos.
|
285,000 | - | 980 | 839 | 4,584 |
| 80 | 88 | Dependable Supply Chain Services
|
282,000 | - | 1,777 | 496 | 1,130 |
| 81 | 88 | John Christner Trucking
|
271,104 | 15,033 | 213 | 733 | 1,184 |
| 82 | 69 | Graebel Moving and Workplace Solutions
|
270,000 | - | 2,000 | 420 | 800 |
| 83 | 91 | Trans-System
|
262,627 | - | 965 | 924 | 1,463 |
| 84 | 94 | Paschall Truck Lines
|
261,211 | - | 1,150 | 3,000 | |
| 85 | 89 | Superior Bulk Logistics
|
260,200 | 7,600 | 1,416 | 1,189 | 2,099 |
| 87 | 91 | Groendyke Transport
|
241,313 | - | 1,423 | 975 | 1,500 |
| 88 | 106 | Black Horse Carriers
|
238,000 | - | 1,965 | 950 | 2,800 |
| 89 | 107 | Transport Investments
|
237,068 | - | 115 | 755 | 1,101 |
| 90 | 102 | Melton Truck Lines
|
236,000 | - | 1,378 | 1,107 | 1,837 |
| 90 | 104 | IMC Logistics
|
236,000 | - | 1,522 | 1,037 | 88 |
| 92 | 109 | Dicom Transportation Group
|
230,874 | - | 1,200 | 812 | 450 |
| 93 | 98 | Brown Integrated Logistics
|
224,655 | - | 1,104 | 1,047 | 5,100 |
| 94 | 86 | Fastfrate Group
|
222,960 | - | 710 | 504 | 1,371 |
| 95 | 96 | Quantix Supply Chain Solutions
|
222,000 | - | 1,100 | 750 | 1,400 |
| 95 | 108 | Martin Transportation Systems
|
222,000 | - | 1,551 | 930 | 1,800 |
| 97 | 93 | Calyx Transportation Group
|
218,198 | - | 500 | 750 | |
| 98 | 105 | Navajo Express Inc.
|
218,000 | - | 1,300 | 1,000 | 1,800 |
| 99 | 103 | Central Freight Lines
|
214,000 | - | 1,448 | 6,648 | |
| 100 | 95 | Wheaton World Wide Moving
|
210,527 | 6,945 | 180 | 717 | 1,075 |
Top For-Hire Carriers on this list are common and contract freight carriers operating in the United States, Canada and Mexico. Companies are ranked on the basis of annual revenue. To be included in the Top 100 or any of the sectors, please send contact information to tteditor@ttnews.com. We will contact you via phone or e-mail to get information about your company prior to publication of the next Top 100 list.
* Tractor count includes company-owned, lease-to-own and owner-operator tractors.
On the Bubble
Nikola Leads Field in Hydrogen Fuel Cell EV Deployment

Hydrogen fuel cell electric vehicles may be envisioned as the future workhorse of a decarbonized longhaul freight sector, but their development has proceeded at a measured pace.
Intermodal Load Growth Cushions Hub Group Q3 Profit Decline

Hub Group profit and revenue fell in Q3 2024, but intermodal load growth mitigated the damage and the carrier’s top executive is becoming more optimistic about the freight environment.
Schneider Q3 Revenue, Profit Decline in Weak Freight Market

The company's results missed expectations from investment analysts on Wall Street, who had been looking for earnings per share of 23 cents and quarterly revenue of $1.33 billion.
Heartland Express in Red for Q3 Again but Loss Narrows

Losses at Heartland Express narrowed year over year in the third quarter as both legacy brands and two more recently acquired units turned in an improved performance.
Ongoing Truckload Weakness, Helene Hurt P.A.M. Q3 Profit

Profits at P.A.M. Transport slumped 61% in the third quarter of 2024 on the back of continued truckload market weakness and the impact of Hurricane Helene.
Forward Air Revenue Soars 92%; Net Loss Hits $34M

The Tennessee-based ground transportation and logistics services provider posted a net loss of $34.2 million, or negative $2.62 a diluted share, for the three months ending Sept. 30.
Retailers Offer ‘Returnless Refunds’ to Reduce Shipping Fees

Returnless refunds are a tool that more retailers are using to keep online shoppers happy and to reduce shipping fees, processing time and other ballooning costs from returned products.
Werner Revenue and Profit Decline on Q3 Market Struggles

The Omaha, Neb.-based carrier’s Q3 net income fell 72% to $6.6 million, or 11 cents per share, compared with $23.7 million, 37 cents, a year ago.
October 30, 2024XPO Net Income Climbs 10% on Strong LTL Pricing in Q3

XPO’s North American LTL segment, its core operation, increased revenue by 1.9% to $1.25 billion from $1.23 billion last year despite declines in shipment volumes.
October 30, 2024Covenant's Q3 Net Income and Revenue Take Slight Dips

The company reported third-quarter net income of $13 million, or 94 cents per share, compared with $13.5 million, 99 cents, in the year-ago period.
October 29, 2024-

2023
-
2022
-
2021
-
2020
-
2019
-
2018
-
2017
-
2016
-
2015
-
2014
-
2013
-
2012
-
2011
-
2010
-
2009
-
2008
-
2007
-
2006
-
2005
-
2004


